The United States is a big and varied place and the best way to gauge how the country is doing as a whole is to break it down into its individual pieces, with the individual pieces being its biggest cities.
That is exactly what The New York Times has done in measuring the recovery in the labor force since the Great Recession. With a city-by-city breakdown, the report first takes a look at unemployment rates among the biggest cities (cities with a civilian labor force of one million or more people). For each city, three points are marked on the graph, the unemployment rates in January of 2000, December of 2009, and January of 2016. While the numbers and how greatly the unemployment has changed in each city differs greatly, they all follow the same pattern; low unemployment in 2000 followed by a sharp spike, which is subsequently followed by a sharp decline. The graph ends up looking like a coniferous forest line, each peak at a different level, but generally uniform in height.
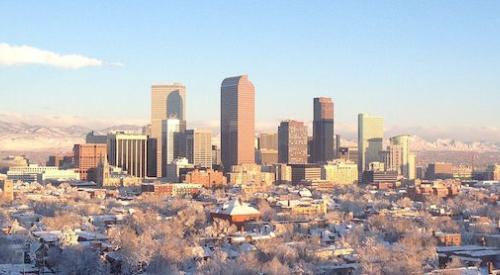
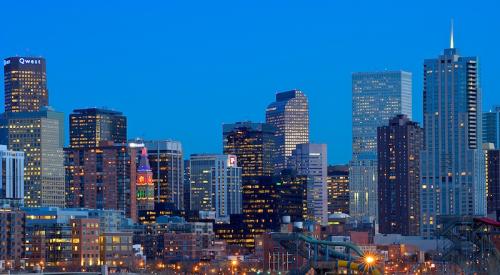
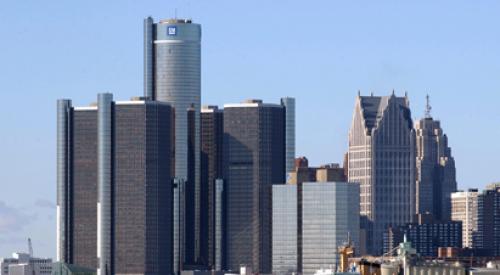
Some of the more notable unemployment shifts came in the cities of Detroit, San Antonio, Austin, and Denver. Detroit had one of the lowest unemployment rates in 2000, but by 2009 had the highest unemployment rate at 15.4 percent. A large decline that occurred between December 2009 and January 2016 stabilized things a bit, but the 5.9 percent unemployment rate is still not back to pre recession levels. In fact, San Antonio and Austin are the only major cities to have had a lower unemployment rate in January 2016 than they did in January 2000. Meanwhile, Denver had the lowest overall unemployment rate for big cities in January 2016 at 2.7 percent.
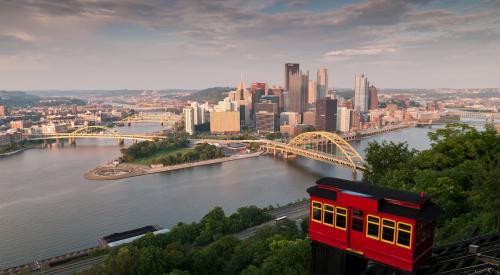
The report also analyzed growth in employment since the recession among these same cities. While Denver has the lowest unemployment rate, it is in the middle of the pack in terms of employment growth, expanding by 15 percent since the end of 2009. San Jose and Austin lead the pack, as each city’s employment has grown by over 25 percent. Cleveland, Cincinnati, and Pittsburgh are the bottom three in terms of growth and are the only three cities on the list that did not see growth of at least five percent.
To see how each city’s numbers broke down and to view accompanying graphs, click the link below.