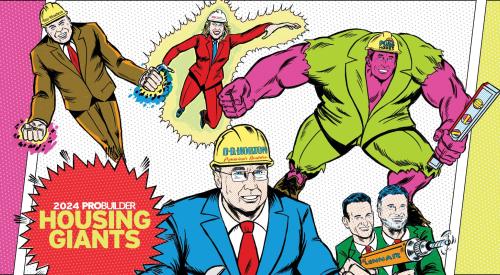
Nearly nothing is familiar in this year’s list of housing’s Giants. Start with the most obvious change: the new company in the number one position, Lennar Corp. Last year’s merger of Lennar and U.S. Home produced a single entity with combined housing revenues of $4.9 billion. What many speculated was merely a play to attract Wall Street attention has instead created the nation’s largest home builder, one that is likely to remain in the number one spot—barring another mega-merger—for some time because of its strong land positions, focus on move-up housing and geographic diversity.
Don’t stop there though. Read on. The top five home builders, each with revenue north of $3 billion, all switched spots. Last year, ranked one through five was Pulte Corp., Kaufman and Broad Homes, D.R. Horton, Inc. and Lennar Corp., and not one of them cracked $4 billion. This year the top three, in order—Lennar, Pulte and Centex all did. Numbers four and five, KB Home (formerly Kaufman and Broad) and D.R. Horton, Inc. reported housing revenues of $3.76 billion and $3.56 billion respectively.
The Up Side of Down
Change among the Giants isn’t only in rank. The issues facing the biggest home builders—both good and bad—are different too.
There is no question: Builder and optimist are synonyms. In fact, being an optimist is probably a prerequisite for inclusion among housings Giants. Who else but a Giant would view the current economic slowdown as an opportunity for market expansion, for new niche market sales or as the perfect time to enhance operational efficiencies? The managers of the Giant home builders aren’t ones to let national nervousness and falling stocks slow growth on the top or bottom line.
However, rose-colored glasses can’t disguise the real threats to another record year for home builders. By more than a two-to-one margin, builders say land issues—availability, acquisition and pricing—could derail housing’s nine-year expansion much more permanently than any economic hurdle. No matter if builders are buying raw land or improved lots, finding dirt is harder, getting it costs more and entitling it takes longer.
A now familiar fixture on the builders’ list of worries is labor. Better than 40% of the Giants still consider attracting qualified labor at the right price as a major obstacle to growth. A new wrinkle in the labor equation is that the shortage of management talent is every bit as acute as that of skilled craftsmen. Expansion plans are put on hold, communities don’t perform to plan, and current staff is stretched too thin because at most companies there are too few field superintendents or area managers.
Rounding out the Giants’ list of their top three hurdles is regulations—the ever-increasing number coming from more sources than ever before. Nothing, it seems, can be built without every constituent having his or her say. Local government, zoning boards, citizens groups, fire departments, etc., all are seeking to be heard in the smart growth debate.
The Freshmen
To housing market watchers the names of the nation’s top five builders are familiar. Less familiar may be the names of the 56 companies that are Giants for the first time. These newcomers are a diverse lot, though many rode the wave of resurgence in multifamily housing to Giant status. Still others benefited from high consumer confidence levels due to a stable economy, not to mention management and market savvy.
Combined, these Giants—new and returning—produced 496,150 stick-built homes, a 7.3% gain over last year. As a percentage of total U.S. housing completions, the Giants account for 30.9% of the U.S. total of 1.6 million homes—only a 2% gain over last year.
However, gains by stick builders were more than offset by declines in manufactured housing producers. Manufactured housing units delivered in 2000 totaled just 274,158, a 22.1% dip from the previous year. The drop off in this sector meant that the total shelter units produced by the Giants was 770,308, off 5.42% from 814,428. For detailed analysis and ranking of the factory-built housing Giants see page 98.
Among stick builders, unit growth was a mixed bag, with three of the five market segments registering increases. The largest unit percentage gain was in low-rise rental units. The 23.2% rise in unit closings and the corresponding 21.2% growth in revenue to $8.9 billion is evidence of renewed strength in multifamily housing, particularly among rental consumers. Gains in for-sale housing continued to be paced by single-family detached homes. Unit closings increased 4.9% to 329,650, less than half the revenue gains posted for the same sector. At $70.5 million, revenue on sales of single-family detached housing increased 13.8% for the Giants. Also on the plus side in unit and revenue growth is for-sale, low-rise condominiums and townhouses, posting a 3.3% and 23% gain respectively.
On the other side of the ledger is high-rise, for-sale and rental housing. For-sale units plummeted 61.9% while revenue fell only 14.2%. Rental high-rise housing closings are 2.1% lower than year-ago figures, however, revenue for the category is up 20.5%.
While year-over-year unit growth was in the single digits, total revenues for the Giants rose 13.5% to $101.5 billion. The single biggest reason for the increase: a 15% jump in revenues from new residential construction. The top line value of new housing totaled $88.9 billion, compared to $77.3 billion a year ago. Also contributing to overall revenue growth was income from rents, fees and interest, land sales and remodeling/non-residential construction.
More & Bigger
It isn’t only home building companies that are getting bigger. The homes they build are too, as is the price tag. In nearly every category of housing, the Giants built bigger houses and sold them for more. For example, among the Giants:
Despite concerns about land issues and regulations, the Giants are still building the majority, 69.5%, of new housing in suburban planned developments. Rounding out the list in order are suburban scattered infill 11.69%, urban planned developments 11.57%, urban scattered infill 4.73% and rural areas 2.46%. The order and percentages are nearly identical to the figures from last year.
One of the most talked about ways the Giants get bigger is through acquisition. This year, as in years past, there have been some notable mergers.
U.S. Home concentrates product at the midpoint of the pricing spectrum, but is also second only to Del Webb in active-adult communities. Lennar, which now specializes in entry-level and first and second move-up homes, has vast land holdings in California, Florida and elsewhere that cry for active adult.
In the fiscal year ended July 31, 2000, Washington delivered 2517 homes for $470 million in revenue. Hovnanian delivered 4367 homes and revenues of $1.10 billion in the fiscal year ending Oct. 31, 2000. They expect to deliver 8000 homes in fiscal 2001.
These acquisitions may foretell things to come as the Giants now compete in a market very different from last year. Critical mass for investors, strong land positions, niche market leadership, management talent—all are reasons for Giants to join together. Does this mean more mega-mergers are a certainty? Hardly. Instead, it means that the Giants earned their place on the list by using every tool available to attain market leadership. If history is any example, this group will continue to do the same.
Top 10 by Housing Type
Market leaders exist in many forms. Here we profile the market leaders by housing types.
Opporunity Knocks
Give Me Land... Lots of Land
The Top Line Soars
Revenues Jump 13.5%
New Home Price Points
Luxury and Lower Price GIANTS
GIANTS Residential Building Activity
The Top 400
Top 400 By Total Revenue
Factory-Built Housing Giants Article
Factory-Built Housing Giants
Top 100 by Closings
Alphabetical Index
2000 Housing Giants


