This article first appeared in the PB January 2000 issue of Pro Builder. NAHB Housing Forecast (1997-2001) Housing Activity (000) 1997 1998 1999 2000 2001 Total Housing Starts 1476 1623 1659 1535 1540 % Change Annual 0.5% 10.0% 2.2% -7.5% 0.4% Single Family 1138 1129 1320 1223 1225 % Change Annual -1.5% 12.5% 3.2% -7.3% 0.2% Multifamily 338 344 339 312 316 % Change Annual 7.6% 1.6% -8.0% 1.1% 2.2% New Single Family Sales 807 890 906 860 854 % Change Annual 6.7% 10.2% 1.8% -5.0% -0.7% Existing Home Sales 4382 4963 5205 4773 4711 % Change Annual 4.5% 13.3% 4.9% -8.3% -1.3% Manufactured Shipments 354 374 353 316 316 Source: NAHB Economics, Dec. 8, 1999. Also See: Housing Slowing to a High Plateau Key Demographic: U.S. Immigrants by Metro Area, 1995-1998 Top New Housing Markets in 2000 PB Topical Ref Management features
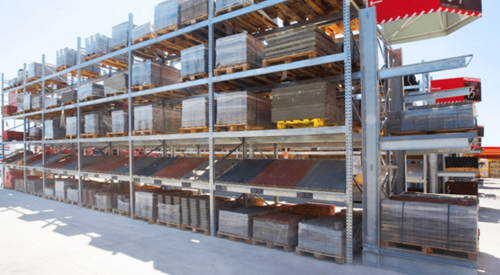
Building Materials Building Materials Price Inflation The Labor Department’s construction materials composite price index rose by 0.5% between December 1999 and January of this year
Mergers + Acquisitions First Mega-Merger May Not Be Last Consolidation of the housing industry has been going on for a decade, and there have been some big mergers during that span
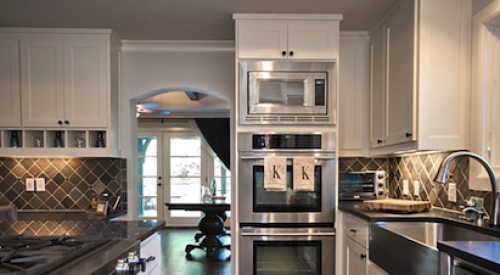
Sales Survey: Majority of builders believe kitchen is key to selling new homes When it comes to selling new homes and feature upgrades, the kitchen remains the heart of the home, according to a survey of Professional Builder readers.
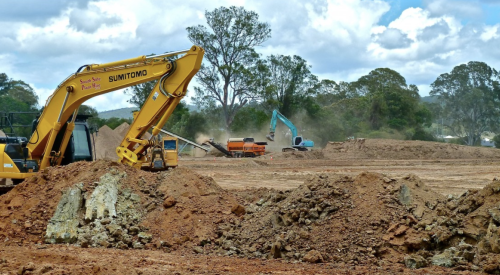
Planning + Development Land Acquisition: How to Avoid Paying Too Much for Land The profitability of any housing community starts with land acquisition