Although the study points to remodeling expenditures as a key factor, it also highlights a growing trend to ever-larger kitchens and baths and therefore a need for greater square footage in countertops.
The study, compiled from government, manufacturer and trade association data, found that laminate countertops top demand, with 259.1 million square feet sold in 2002 and a projection of 277 million in 2007. Still, countertop alternatives are gaining acceptance and market share, leaving laminates with only 2.1% annual growth from 1997 to 2002.
Natural stone has shown the strongest growth during the past few years. The 2003 Freedonia study reveals 14.3% annual growth since its 1997 study. Stone's growth spurt is expected to level off somewhat but still remain quite high - Freedonia predicts 6.3% annual growth from 2002 to 2007.
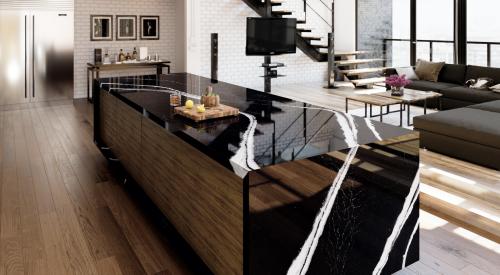
Engineered stone, which is enjoying huge popularity in new and remodeled homes, was not included in the '97 study, but the current study found that 15.9 million square feet of it was sold in 2002. Freedonia forecasts that the product, which includes brands such as Cambria, CaesarStone, Silestone and Zodiaq, will enjoy 9.5% annual growth from 2002 to 2007.
The solid-surface category also showed growth, as did the "other" category, indicating that tile, stainless steel, concrete, wood and other countertop materials remain viable alternatives.
|
|||||||||||||||||||||||||||||||||||||||||||||||||||||||||||||||


