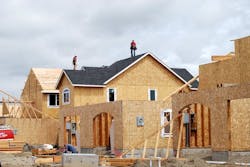
Declines in both single- and multifamily starts pushed nationwide housing production down 6.5 percent in May to a seasonally adjusted annual rate of just over 1 million units, according to figures from the U.S. Department of Housing and Urban Development and the U.S. Census Bureau. However, single-family permits, which can be an indicator of future building activity, rose 3.7 percent.
"The dip in single-family production shows builders continue to move carefully in adding inventory," said Kevin Kelly, chairman of the National Association of Home Builders (NAHB) and a home builder and developer from Wilmington, Del. "They are also facing supply chain issues, such as access to lots and labor."
Single-family housing starts were down 5.9 percent to a seasonally adjusted annual rate of 625,000 units in May; meanwhile, multifamily production fell 7.6 percent to a seasonally adjusted annual rate of 376,000 units.
"The encouraging news is that single-family permits are up by almost 4 percent," said NAHB chief economist David Crowe. "The modest increase is evidence that builders expect continued release of pent-up demand and a gradual expansion of the housing market. We are still forecasting a 12-percent increase in total housing starts for the year."
Regionally in May, combined single- and multifamily housing production fell in the Northeast, the Midwest, and the West, with respective losses of 25.2 percent, 16.5 percent, and 16.3 percent. Meanwhile, the South posted a 7.3 percent gain.
Issuance of building permits declined 6.4 percent to a seasonally adjusted annual rate of 991,000 units in May. This was due entirely to a decrease in the multifamily sector, where permits registered a 19.5-percent loss to 372,000 units. Single-family permits increased to 619,000 units.
The Northeast and Midwest registered overall permit gains of 3.5 percent and 3.8 percent, respectively, while the South and West posted respective losses of 7.3 percent and 15.2 percent.
Looking at the three-month moving averages for regional HMI scores, the South and Northeast each edged up one point to 49 and 34, respectively, while the West held steady at 47. The Midwest fell a single point to 46.
Sign-up for Pro Builder Newsletters
Get all of the latest news and updates.
