Skip to navigation Skip to main content Skip to footer
flexiblefullpage

Residential Products Online content is now on probuilder.com! Same great products coverage, now all in one place!

billboard
This article first appeared in the PB October 2006 issue of Pro Builder.

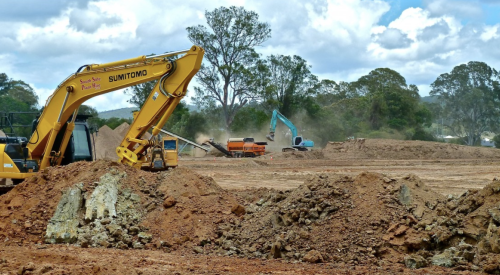
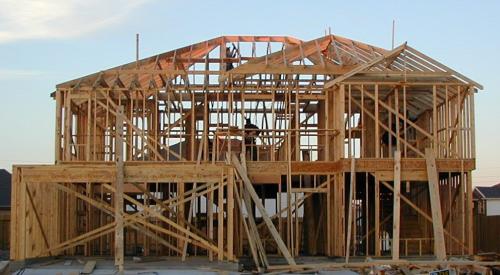
The continuing collapse of housing markets across the country is not uniform; Texas and the Carolinas are bucking the downward trend. In many ways, this slowdown is similar to what happened between 1990 and 1992, although that one had a national economic recession to deepen it. We've avoided that this time — so far.

Fannie Mae chief economist David Berson points out that years of frenzied housing investor activity from 1987 to 1989 preceded the 1992 housing slump. Markets in the worst shape now had investors drive housing price increases to unsustainable rates. And today, "the investors have not only stopped buying, they are selling," says Berson. "That's why inventories and cancellation rates are up dramatically. The markets in most trouble are those that had the most investors, without other factors to offset it such as good job growth, in-migration and strong household formations. Those markets have the potential for significant declines in housing activity and prices."

Another set of housing markets have a different problem: weak economies. You won't see as big a drop in housing activity there as in the investor-driven markets. "There weren't many investors in southern Michigan," Berson says, "but there's the potential for a long housing downturn there."

Berson predicts a drop in home sales this year of 10 to 15 percent, followed by a further decline of 5 to 7 percent in 2007.

"In the early 1990s, we had five years where price gains averaged only about 2 percent a year, well below the rate of inflation," Berson says. "The good news today is other parts of the economy are growing well. That should offset the damper of a housing slump. But growth will be below-trend because housing is slowing the national economy."


Housing Cycle Barometer

Management consultant John Burns recently produced a housing cycle barometer by calculating the ratio between home prices and income levels, then comparing those ratios today against the 25-year history of markets across the country. What Burns found raises an alarm: only 13 markets fall below their median affordability level. Three are on median and 84 are above it.

The four inexpensive markets — Pittsburgh, Cleveland, Cincinnati and Indianapolis — have stagnant local economies. Nine markets — New York; Washington, D.C.; Los Angeles; Seattle; Portland, Ore.; Baltimore; Edison, N.J.; Nassau, N.Y.; and Naples, Fla. — have worse affordability today than in the early 1980s, when mortgage rates were above 18 percent.

The map shows the most overpriced markets are along the coasts, where supply constraints aggravate the situation. The barometer ranges from 0 to 10; Burns categorizes markets between 7.5 and 10 as potential housing bubbles, those from 5.0 to 7.5 as overpriced in comparison to history, and 0.0 to 5.0 as no housing bubble.

However, Burns cautions, with sales slumping, prices are probably past their peak everywhere except North Carolina and Texas, where houses still sell fast. "[They] have strong economies and didn't see the investors that drove up prices elsewhere," Burns says. "But now there are signs investors are flocking there because those are the only places it's possible to flip houses" he says. "A lot of money was raised for real-estate investments, and there are still people trying to place it."


Red Circles show where there is no housing bubble, 0.0 to 5.0; White Circles show where the market is overpriced in comparison to history, 5.0 to 7.5; Blue Circles show where a potential housing bubble could occur, 7.5 to 10.0.

leaderboard2
catfish1