Will the economic recovery be a W, a K, or a hockey stick?
At least for the housing market, the line graph is looking like a V-shaped rebound, according to the latest results from the Realtor Confidence Index Survey. The survey of 4,000 agents by the National Association of Realtors suggests the strong housing demand is likely to be sustained in the coming months.
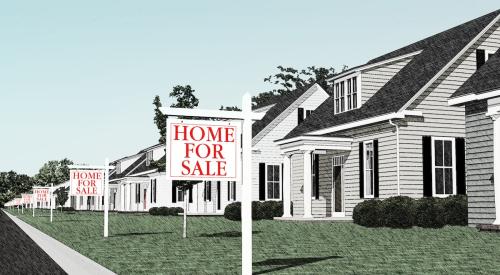
Existing-home sales rose a record 24.7% in July to an annualized rate of 5.86 million, which is higher than the pre-pandemic February level (5.76 million). On a year-to-date basis, existing-home sales (2.917 million) are just 5% below last year’s seven-month period level (3.062 million). The median existing-home sales price rose 8.5%, to $304,100, as demand strongly absorbed the supply coming into the market. As of the end of July, the level of inventory of homes for sale on the market was only equivalent to 3.1 months at 1.5 million homes, down 21.1% from one year ago.
Properties were typically on the market for 22 days, a record low since NAR collected this survey-based information in 2011, according to the August Realtor Confidence Index Survey, a monthly survey of Realtors on their transactions during the month. One year ago, properties typically sold in 29 days. This is also faster than the median of 36 days in February prior to the coronavirus outbreak. Sixty-three percent of properties sold within one a month, compared to 51% one year ago and 47% in February.
To learn where properties are selling the fastest and how first-time buyer participation is faring: