Survey of Private Builders 2015
The results are in from 2015’s Executive Survey of private home builders. In general, 2014 was a better year for home builders, and they expect further improvement in 2015. It’s no wonder that the builder confidence index is at an eight-year high.
While 2014 brought plenty of improvements to celebrate (see The Good News, below), there were notable areas of performance slippage ranging from employee turnover to cycle times (see The Bad News). The survey also asked each of the 30 geographically diverse home building executives to peer into his or her budget’s crystal ball and tell us what they’re forecasting for 2015.
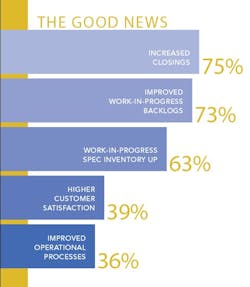
The Good News—Top 5 (Improvement)
- Closings: 75 percent of the Executive Survey respondents reported increased closings, with the average closings units up 15 percent over 2013. Three out of four respondents saw similar or increased closings, and the average “improved” builder increased closings by 19 percent. Overall, sales still appear to be accelerating, but at a slower rate than last year’s 32 percent year-over-year growth.
- Backlogs: 73 percent reported improved work-in-progress backlogs, with the average sold backlog increasing by 28 percent.
- Spec inventory: 63 percent reported slightly larger speculative inventory work in progress, with average speculative backlog increasing 7 percent.
- Customer satisfaction: 39 percent reported higher or, at a minimum, stabilized customer satisfaction ratings in terms of product quality and willingness to refer (WTR). The average WTR for all respondents was 88 percent, which has yet to return to the pre-recovery 2012 levels of 92 percent.
- Operational processes: 36 percent reported improved operational processes due to investments in system upgrades, enhancements, or staffing.
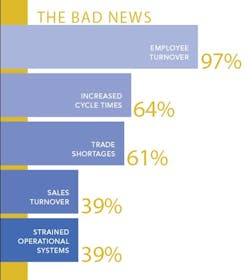
The Bad News—Bottom 5 (Slippage)
-
Employee turnover: 97 percent of respondents reported employee turnover (two out of three employees left voluntarily). Correspondingly, 72 percent of respondents are looking to add to their staff in 2015. The most common areas of staffing needs were: sales, 50 percent; office, 43 percent; field, 25 percent; and warranty, 10 percent. Oddly, while admitting that most will be seeking additional staff, virtually none of the survey respondents expected to lose any of their staff to other builders.
Keeping good staff could be a challenge in 2015, so we asked Veronica Ramirez, CEO of executive search firm Joseph Chris Partners, in Kingwood, Texas, for some employee retention insights.
“If you haven’t reevaluated compensation for your entire organization,” Ramirez says, “then you’re behind the game, as it’s safe to say that your competitors have. You can trust me on this; your staff are getting calls from recruiters. That said, compensation isn’t always the reason people leave. Believing in their leader, having a clear vision, being in alignment with the company culture, and a positive team environment are what I’m seeing as important factors in retaining top performers.” -
Cycle times: 64 percent of survey respondents said that cycle times expanded by an average of nine days and now average 120 days. Scott Sedam, president of TrueNorth Development and a Professional Builder contributor, has a “date calculator” that shows each day lost in cycle time equates to $400 to $700 slippage per day. Interestingly, despite the fact that cycle slippage was a big source of pain in 2014, few respondents noted it as a concern for 2015. The general perception is that since days were added to the schedule, the problem was fixed. This approach could fix the cycle time issue, if the source of slippage is misestimated activity durations (i.e., finishing drywall), or missing activities (i.e., quality assurance inspection).
However, if the cycle time loss is due to some other cause (vendor loading, poor onsite supervision, etc.), then adding days to a schedule would be as effective as adding a bigger bilge pump to a leaky boat. Builders should ensure that their schedules are correct and strictly managed before deeming “time” as the antidote for the schedule performance problem. Mathematically, about a third of the aforementioned increase in year-over-year sales backlog was actually due to longer cycle times, not necessarily to better sales. - Trade partner performance: Approximately the same percentage that cited cycle time losses also indicated that quality trade shortages (61 percent) hampered production and cycle times. This reinforces the notion that adding days to the schedule may not address the larger issues. Builders most insulated from the cycle and trade base issues were the “builders of choice.” The trick is, how does a builder become a builder of choice? According to Chuck Shinn, PhD, president of Builder Partnerships, in Littleton, Colo., “To become a builder of choice, the trade partner must feel that the builder is organized, efficient, pays fairly (and promptly), and always has homes ready as scheduled. Anything less sends a message of disrespect to the trade partner and signals a culture of nonconformance.” Therefore, it seems that predictability and fairness trump time in the trade partners builder-of-choice designation and, if done incorrectly, adding time may actually do just the opposite by allowing even more unpredictability.
- Salespeople: 39 percent listed sales turnover and training as a 2014 production constraint. Obviously, a productive and professional sales team is a significant asset for any home building company. Inversely, it could be concluded that 61 percent feel that their sales pace adequately meets their system capacities (back office, production, vendor loading, etc.).
- Systems: 39 percent of the respondents also cited internal operations/systems (i.e., estimating, drawing, accounting, etc.) to be strained in 2014 to the point of constraint. Respondents were not clear if this constraint was on sold jobs or in the development of new products. Often we see that the same team responsible for production work is also the new-plan development team and gets pulled from its planned new product development tasks to man the oars of production. The delay in new product, or rushed production jobs with inaccurate option pricing, purchase orders, drawings, etc., has a significant impact—albeit difficult to quantify—on the top and bottom lines.
What about the customer?
Customer satisfaction ratings have yet to ascend to 2012’s levels. As new-home starts improved, the builders left standing after the housing depression experienced a surge in sales activity beginning in 2013, some more than doubling their 2011 to 2012 business.
The factors noted in The Bad News coalesced into less-satisfied customers in terms of product quality and the homebuying experience. The average builder saw willingness-to-refer rates drop 5-10 points during this business expansion phase, and those rates have yet to recover.
The good news is that customer satisfaction ratings didn’t get any worse in 2014; with WTR stabilizing at 88 percent (and this was from a sampling of “very good, customer-centric” home builders). We have been told by other industry experts that satisfaction ratings for less customer-centric builders declined by 10-20 points! Undoubtedly, lower willingness to refer rates will be headwinds to future referral sales, putting more pressure on marketing and sales efforts.
Compared with the previous year’s customer satisfaction ratings, 2014 customers had smoother mortgage and closing experiences. On the front-end mortgage application, customers rated the mortgage communications significantly better. On the closing end of things, the vast majority of homes appraised for their full selling price, thereby eliminating last-minute stressful renegotiations—a good thing for all parties at the closing table. On the other hand, customers and builders struggled with pinpointing the closing date, adding some stress and sapping some customers’ enthusiasm for their big move.
Top 5 Concerns for 2015 & Beyond
- Land/lots supply: Respondents felt they had sufficient land/lots for the present sales rates, but not for long, or if sales rates increase. In either case, most respondents were concerned about a short runway in terms of reliable lot inventory.
- Quality trade partner shortages: Respondents felt that there were too few quality trades to go around for all builders. This quality trade partner shortage is expected to lead to pricing premiums and cost increases, making the “builder of choice” appellation even more valuable.
- Internal systems capacity: Respondents’ perceptions about their systems varied from being bogged down with workloads, to not being granular enough to give sufficient notice of slippage (costs, time, cash flow, and profits). Nearly half of the respondents listed 2015 system improvements as a necessity.
- Customer satisfaction ratings: These are acknowledged to be too low, and are expected to improve, but not without product quality improvements and better schedule conformance.
- Sales performance: Almost all respondents worry about their sales team’s ability to continue to feed their respective production machines.
- Healthy top- and bottom-line projections: The 2015 Executive Survey showed a projected increase in 2015 closing revenue of 19 percent and projected margin increases of 15 percent (to a median gross profit margin of 21 percent).
Fodder for Insomnia
We couldn’t help but chuckle, and in some cases cringe, at the variation in answers to the question: When you step away from the office, what is it that keeps you awake and/or worrying at night?
The worries were equally spread among things that are not within the executives’ control (economy, interest rates, oil, etc.) and things that are within their control (strategy, land/lots, processes, and customer satisfaction).
There is still some housing depression hangover evident in those who worry “if the next down-cycle has already started.” But those who worry too much about the uncontrollable things may be sacrificing valuable resources that could be directed at potential improvements within their control. It’s obvious that these executives’ concerns are also reflections of the individual, more than anything else. Among our respondents, there is a wide range of personalities, which is a good thing because it provides a variety of perspectives on our industry’s challenges, threats, and successes.
About the study: Surveys were sent to 30 geographically diverse home building executives. These 30 respondents closed 6,360 homes in 2014 (an increase of 15 percent over 2013 closings). While this study has significant quantitative data, it also includes empirical data, opinions, and comments that are more qualitative in nature. We would like to thank the respondents and interviewees for sharing their information, opinions, and 2015 outlook with Professional Builder readers. The survey was administered, interpreted, and this article written by Charlie Scott of Woodland, O’Brien & Scott. PB
--
Charlie Scott has more than 25 years of hands-on home building experience, much of it in senior management positions with an award-winning, nationally recognized Midwestern builder. Today, Scott is an owner of Woodland, O’Brien & Scott, and helps North American home builders grow their own customer-centric cultures, pursue operational excellence, and increase referral sales. Reach him at [email protected].


