Project effectiveness & efficiency tool
There are many ways to determine how successful a process or project is. These methods normally involve detailed metrics and may include cycle-time reduction, number of process steps and customer satisfaction. The more improvement projects there are, however, the more difficult it is to monitor their progress, especially in relation to one another and at a high level.
One way to monitor either a process or project is to evaluate its current level of effectiveness and efficiency. ASQs Quality Progress defines effectiveness as "the state of having produced a decided on or desired effect," and efficiency as "the ratio of the output to the total input in a process."1 ISO 9000 defines effectiveness as "the extent to which planned activities are realized and planned results achieved," and efficiency as the "relationship between the result achieved and the resources used."2
The combination of these metrics reveals the ideal result and provides a fully rounded evaluation.
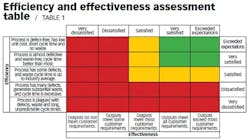
Using this effectiveness and efficiency concept, a table (see Table 1) was developed to allow a simple assessment of each. The table uses customer satisfaction to assess effectiveness and resources to assess efficiency levels. This can be used to assist in determining which process to focus on for improvement in association with other tools and determinants. The table allows a group to make decisions quickly, visualize the results and compare processes simultaneously.
Each axis of the table is evaluated individually—together the results determine the combined level of effectiveness and efficiency. The detailed comments focus on the degree to which the relevant and specific customer requirements are met, as well as the level of defects and cycle time involved. Opposite these comments are more high-level considerations that act as a guide to evaluate the efficiency and effectiveness satisfaction levels.
The table allows for a visualization of the current state of a process or project. Those that fall in the green zone are highly effective and efficient. Those in the yellow zone achieve satisfactory levels but have opportunities for improvement. Those in the red zone need significant work due to their low levels of effectiveness and efficiency, or they may be out of balance. This means a process may exceed customer expectations even though it is plagued with defects and has long, unpredictable cycle times.
In the opposite situation, a highly efficient process with zero defects and short, predictable cycle times may be ideal for the manufacturing process, but it may not meet any customer requirements. Customer satisfaction and other critical issues will fail, resulting in significant recall, rework and redesign costs.
The process of using this table for evaluation can help generate group discussion and consensus. It also creates a sense of focus and coordination with regard to a range of projects or processes and in identifying opportunities for improvement.
You can access this paper and the diagram via the following links
http://asq.org/img/qp/092801_table1.gif
http://asq.org/quality-progress/2009/07/back-to-basics/table-talk.html
Leonard, D (2009) Back to Basics, Table Talk: A Simple Table Can Assess Project Effectiveness and Efficiency, Quality Progress, July, p 72
References
- QP Staff, "Quality Glossary," Quality Progress, June 2007, pp. 39-59.
- International Organization for Standardization, ISO 9000: Quality Management Systems, Fundamentals and Vocabulary, www.iso.org/iso/catalogue_detail.htm?csnumber=42180

