Market Mismatch
A growing number of homebuyers nationwide are having trouble finding homes for the right price, or at least what seems like the right price. In addition to low inventory of homes for sale, many markets are seeing higher demand for homes in price ranges that, in all likelihood, aren't realistic.
Mismatched markets are affecting all kinds of buyers and sellers in different ways, and it varies from metro to metro. If a great number of home values in an area fall within the same price range as others, options for buyers will be limited. On the flip side, home sellers that are marketing their homes at a price range few buyers are interested in will suffer, too (Photo via pexels.com).
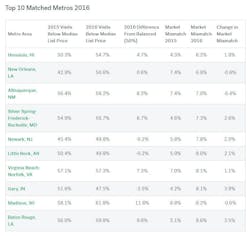
Overall, 53.4 percent of all properties viewed nationally were priced below the median listing price in their area, which creates mismatched markets nationwide. Mismatched markets occur when the distribution of home prices that users are viewing varies from the distribution of the prices of all listings. The U.S. mismatch rate is at 10.4 percent nationwide. The cities with the highest mismatch market scores come in far ahead of other major metropolitan areas: Home searches in Houston and Dallas show many home buyers looking for homes that are far below the median listing price.
The Nation’s Mismatched Market Kings
Currently there are 9,493 homes for sale in the Houston market, with an average price listing price of $416,816.00. Market trends show a 2 percent week-over-week rise in average listing price, which seems fair. But the mismatch rate tells a different story. Houston leads with a mismatch rate of 31.2 percent, and reports show that 75.5 percent of properties viewed are below the median price listed. Houston’s employment rate may be what accounts for such a high deviation from the national average. Right now, the national average of over-the-year job growth is at 1.7 percent while Houston’s growth is only at .4 percent—the lowest of the ten largest metros in the country. While the national average has remained consistent, Houston’s growth rate has plummeted in the past two years, partly due to oil industry declines. Consequently, potential home buyers tend to be conservative with price points, which has created a high deviation.
Following close behind is Dallas, TX, with a mismatch rate of 30.3 percent in 2016. But in this case, job growth doesn’t seem to be the issue. Dallas job growth has accelerated in the past year, so it stands to reason that homebuyers would be less conservative with their home searches. The dilemma in Dallas may be a surge in price per square foot over the past year, which has further separated listing prices and price interest.
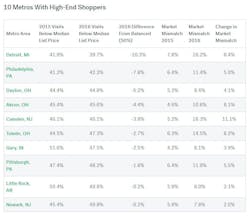
There are other cases where homebuyers search for homes that are more expensive than what is available. For example, Detroit has a mismatch of 16.2 percent, and only 39.7 percent of properties viewed were below the median price listed. Out of the top 100 metros in the country, only ten fall into this category; others include: Philadelphia, Dayton, Akron, and Camden.
On the Other Hand...
There are other cases where homebuyers search for homes that are more expensive than what is available. For example, Detroit has a mismatch of 16.2 percent, and only 39.7 percent of properties viewed were below the median price listed. Out of the top 100 metros in the country, only ten fall into this category; others include: Philadelphia, Dayton, Akron, and Camden.


